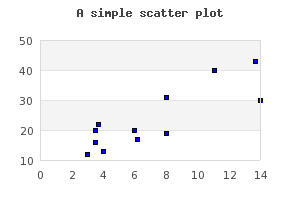
Scatter plots are used to display a number of data points given by there x- and y-coordinate. The difference from a line plot is that the x-coordinate must always be specified. Each point is stroked on the image with a mark as with line plots. The stroked marks can also be connected with an optional line.
To use a scatter plot the module "jpgraph_scatter.php" must
first be included in the script.
Note
Carefully reviewing the constructor for line plots shows that it also can accept both a x- and y-array with coordinates. This means that a line plot can also be used to create a scatter plot. However scatter plots have some formatting options not available for line plots.
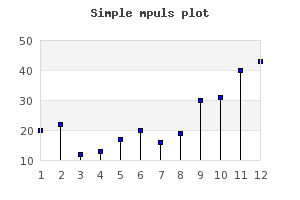
Even though the normal use of scatter plots is to supply both x- and y-coordinates it is still perfectly possible to use a text- or int-scale for the x-coordinates to just enumerate the points (the points will be placed along an imaginary integer scale). This is especially useful when using the "Impulse" type of scatter plot as shown below.
If no x-coordinates are specified each value will be placed at consecutive
x-coordinates [1,2,3,..]
A scatter plot is constructed by creating an instance of the class
ScatterPlot supplied with the proper arguments, i.e.
1 | $scatterplot = new ScatterPlot($ydata, $xdata); |
The following example shows a very basic scatter plot
Example 15.3. A basic scatter plot (scatterex1.php)
1 2 3 4 5 6 7 8 9 10 11 12 13 14 15 16 17 18 19 20 21 22 | // content="text/plain; charset=utf-8" require_once ('jpgraph/jpgraph.php'); require_once ('jpgraph/jpgraph_scatter.php'); $datax = array(3.5,3.7,3,4,6.2,6,3.5,8,14,8,11.1,13.7); $datay = array(20,22,12,13,17,20,16,19,30,31,40,43); $graph = new Graph(300,200); $graph->SetScale("linlin"); $graph->img->SetMargin(40,40,40,40); $graph->SetShadow(); $graph->title->Set("A simple scatter plot"); $graph->title->SetFont(FF_FONT1,FS_BOLD); $sp1 = new ScatterPlot($datay,$datax); $graph->Add($sp1); $graph->Stroke(); |
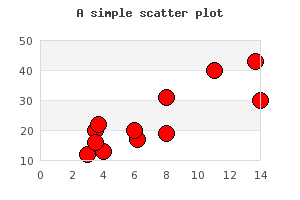
In the same way as we adjusted the look and feel for markers for line plot (see
??) we can do the same here as shown in Figure 15.66. Adjusting the size and color of the marker ( scatterex2.php)
The marks are accessed through the instance variable
ScatterPlot::mark (in complete analogy with line plots)
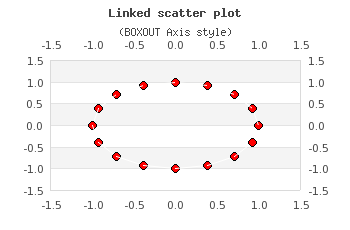
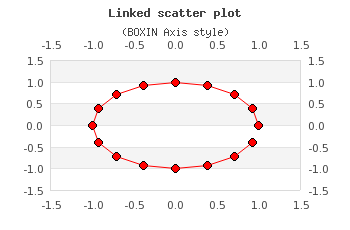
It is possible to combine the individual data points with a line - a link. The
properties for this link can be accessed by using the instance variable
ScatterPlot::link.In order to enable the link the method
ScatterPlot::link::Show() must first be called.
Note
For historical reasons there is also a utility method ScatterPlot::SetLinkPoints() where links can be enabled and adjusted. However, this method will be removed in future versions of the library.
The properties that can be adjusted are the normal line properties, i.e. weight, color and line style. The following code snippet shows how to add a link line with a dotted style drawn in black to scatter plot.
1 2 3 4 5 6 7 8 9 | // Enable the link lines $scatterplot->link->Show(); // Set the properties $scatterplot->link->SetWeigth(1); $scatterplot->link->SetColor('black'); $scatterplot->link->SetStyle('dotted'); |
In Figure 15.67. Combining data points with a dotted line ( and Figure 15.68. Combining data points with a red line scatterlinkex3.php)( there are two variants of adding a link
line to a scatter plot. For those figures we have also used two of the
predefined scientific axis styles (see Predefined scientific axis setups).scatterlinkex4.php)
|
|
|
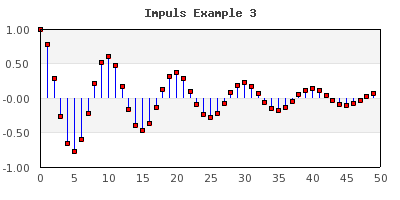
A variant of scatter plots often used electrical engineering is the stem plot as shown in Figure 15.56. Supported pattern fills for bar plots
This variant of the scatter plot is created by calling the method
1 | $scatterplot->SetStem(); |
Tip
It is possible to create a stem graphs without any mark by specifying the mark type as (-1) . That way only the impulse lines will be drawn.
In order to adjust the look and feel of the stems the following methods can be used
-
ScatterPlot::SetWeight($aWeight) -
ScatterPlot::SetColor($aColor)
Another example of stem plot is shown in Figure 15.70. Adjusting the overall look and feel for the stem graph (
where we have adjusted both the look and feel of the stem plot as well as the
position of the x-axis.impulsex3.php)
There is also another complex impulse example shown in Figure 14.58. Adding a static line at y=0 to simulate an extra 0-axis ( where we have used a impulsex4.php)PlotLine to
create a "virtual" x-axis.
A variant of scatter plot is the so called Field Plots.
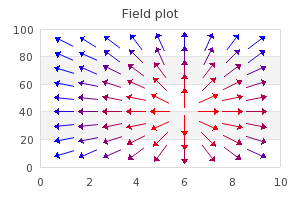
This is basically a scatter plot where each scatter point is an arrow with a direction between 0 to 359 degrees. This effectively allows the visualization of 3 parameters at each point (x,y and angle).
A field plot is created as an instance of class FieldPlot with
three argument
-
an array of y-coordinates
-
an array of x-coordinates
-
an array of angles
as the following code snippet shows
1 | $fieldplot = new FieldPlot($datay, $datax, $angle); |
The size and color of each arrow in the field plot is controlled by accessing
the property FieldPlot::arrow and using the two methods
-
FieldPlot::arrow->SetSize($aSize,$aArrowSize=2)$aSize, Specifies the length (in pixels) of the arrow$aArrowSize, The arrow size is specified as an integer in the range [0,9]. The possible arrow sizes are shown in Figure 15.71. Possible sizes of arrow heads for field plots.
-
FieldPlot::arrow->SetColor($aColor)The color of the arrow
Another way to individually format each arrow is to use a callback method. The callback method must have three arguments x- , y-coordinates and angle. The callback method must return an array with three elements (color,size,arrow size). The callback method is specified by calling
-
FieldPlot::SetCallback($aFunc)
Figure 15.72. A field plot ( shows a field plot with a callback
function.fieldscatterex1.php)
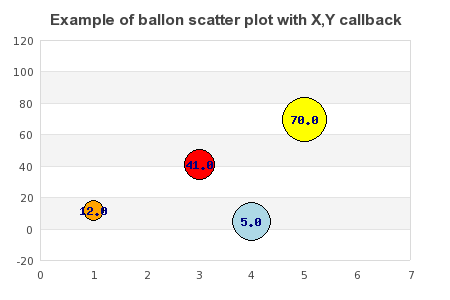
This is a variant of scatter plot where each data point is a filled circle and the size of the circle is dynamically adjusted. This makes it possible to display three values at each data point (x,y,"size"). There is no need for a specific plot type for this since these types of plots can be constructed with an ordinary scatter plot and a mark formatting callback.
In order to specify a callback for the marks the following method is used
-
ScatterPlot::mark::SetCallbackYX($aFunction)The argument for the callback function is y- and x-value for the data point. The return value should specify the format of the marker as an array of (width, border_color, fill_color, filename, image scale). All values must be included.
We can now create a balloon plot as follows.
-
Create a data array that specifies the data including both x- and y-coordinate, color and size of the filled circle. For example as:
1
2
3
4
5
6
$data = array( array(1,12,10,'orange'), array(3,41,15,'red'), array(4,5,19,'lightblue'), array(5,70,22,'yellow') ); -
We must now convert this to some suitable data for a scatter plot. The only thing to keep in mind is that we need to share the data with the callback function and for that purpose we store the formatting data in an external array indexed by the x,y-value.
1
2
3
4
5
6
7
8
9
10
$n = count($data);
for( $i=0; $i < $n; ++$i ) {

    $datax[$i] = $data[$i][0];
    $datay[$i] = $data[$i][1];


    $format[ strval($datax[$i]) ][ strval($datay[$i]) ] = array( $data[$i][2], $data[$i][3] );

}
The callback function can now be specified as
1
2
3
4
5
6
function FCallback($aYVal,$aXVal) {
    // We need to access the global format array
    global $format;
    return array($format[ strval($aXVal) ][ strval($aYVal) ][0],'',
                 $format[ strval($aXVal) ][ strval($aYVal) ][1],'','');
}
The callback function will now return the format value (size and color) we specified originally depending on the x,y - coordinate. The callback function can be installed with a call to
1
$sp1->mark->SetCallbackYX('FCallback'); -
The final step is to create an ordinary scatter plot with a marker that is specified as a filled circle
1
2
$sp1 = new ScatterPlot($datay,$datax);
$sp1->mark->SetType(MARK_FILLEDCIRCLE);
As an optional additions we can also enable the display of the values at each data point by calling
1 2 | $sp1->value->Show();
$sp1->value->SetFont(FF_FONT1,FS_BOLD); |
Putting all these together gives the result shown in Figure 15.73. Using format callback to create a balloon plot ( balloonex2.php)
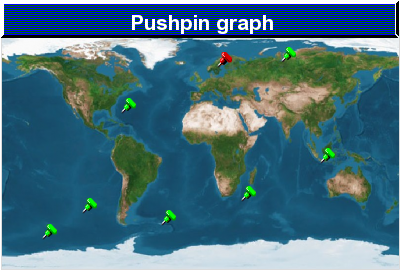
Geo-maps (a.k.a. Geo-charts, push-pin graphs) is used to illustrate locations
around the world by putting markers on a flat projection of the earth. A Geo-map
is done by adding a Worldmap background to a standard scatter graph. The library
includes a suitable background in the "Examples/" directory
"wordmap1.jpg". This can then be done as the following
example shows
Example 15.4. An example with geo maps (pushpinex1.php)
1 2 3 4 5 6 7 8 9 10 11 12 13 14 15 16 17 18 19 20 21 22 23 24 25 26 27 28 29 30 31 32 33 34 35 36 37 38 39 40 41 42 43 44 45 46 47 48 49 50 51 52 53 54 55 56 57 58 59 60 | // content="text/plain; charset=utf-8" require_once ('jpgraph/jpgraph.php'); require_once ('jpgraph/jpgraph_scatter.php'); DEFINE('WORLDMAP','worldmap1.jpg'); function markCallback($y,$x) { // Return array width // width,color,fill color, marker filename, imgscale // any value can be false, in that case the default value will // be used. // We only make one pushpin another color if( $x == 54 ) return array(false,false,false,'red',0.8); else return array(false,false,false,'green',0.8); } // Data arrays $datax = array(10,20,30,40,54,60,70,80); $datay = array(12,23,65,18,84,28,86,44); // Setup the graph $graph = new Graph(400,270); // We add a small 1pixel left,right,bottom margin so the plot area // doesn't cover the frame around the graph. $graph->img->SetMargin(1,1,1,1); $graph->SetScale('linlin',0,100,0,100); // We don't want any axis to be shown $graph->xaxis->Hide(); $graph->yaxis->Hide(); // Use a worldmap as the background and let it fill the plot area $graph->SetBackgroundImage(WORLDMAP,BGIMG_FILLPLOT); // Setup a nice title with a striped bevel background $graph->title->Set("Pushpin graph"); $graph->title->SetFont(FF_ARIAL,FS_BOLD,16); $graph->title->SetColor('white'); $graph->SetTitleBackground('darkgreen',TITLEBKG_STYLE1,TITLEBKG_FRAME_BEVEL); $graph->SetTitleBackgroundFillStyle(TITLEBKG_FILLSTYLE_HSTRIPED,'blue','darkgreen'); // Finally create the scatterplot $sp = new ScatterPlot($datay,$datax); // We want the markers to be an image $sp->mark->SetType(MARK_IMG_PUSHPIN,'blue',0.6); // Install the Y-X callback for the markers $sp->mark->SetCallbackYX('markCallback'); // ... and add it to the graph $graph->Add($sp); // .. and output to browser $graph->Stroke(); |
Another example of using worldmaps with Pie graphs is shown in Adding background images to Pie graphs
Note
The library does not include any conversion utility to/from
Longitude/Latitude to UTM coordinates that could be used to
automatically position data marks on the Mercator projection map. The
options to stretch and scale the worldmap would make it rather
cumbersome to create a accurate conversion. For a good overview on this
kind of translation see Converting
Latitude/Longitude to Universal Transverse Mercator
(UTM)
