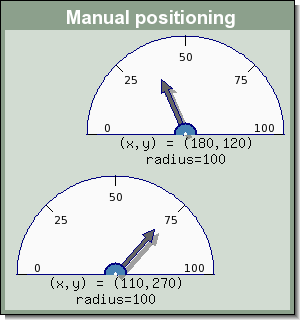
The library supports unlimited number of odometers plots in a single graph. They can either be positioned manually within the graph by specifying absolute coordinates for the centers of the odometers or it can be done in a semi automatically way to avoid the hassle of calculating exact pixels positions.
Tip
Remember that there is a caption property of the odometer plot as well as the main graph class and it is suitable to add a separate caption text to every odometer to separate them.
As have been shown in the previous example adding several odometer to the same graph
is simply a matter of creating multiple instances of class Odometer and
then adding them to the graph by calling the OdoGraph::Add() method.
To manually position the odometer plot the following method is used
-
OdoPlot::SetPos($aX, $aY)Specifies the position of the odometer plot in either absolute coordinates (>1) or as fraction of the width/height when specified as fractions (in range (0.0 to 1.0)
Note
There is a minor difference when using odometer captions and specifying the y coordinate using fractions in that the y-coordinate and the radius will automatically adjust to the height of the caption size. This guarantees that the total image (odometer+caption) will always occupy the same total height in the image regardless of the size of the caption.
The top left corner of the graph is (0,0)
The following example manually positions to odometer plots in the graph, one at the top right corner and one in the bottom left corner.
Note
Those familiar with Java AWT classes will recognize this concept
Normally we don't want to have to calculate the absolute x and y coordinates when positioning odometers. A much better concept would be to just tell the library to position three odometer horizontally or perhaps vertically without us having to figure out the exact coordinates our self.
This is where layout classes come in handy.
There are two types of layout horizontal and vertical. To specify that two odometers should be positioned side by side (horizontal) first a new layout object is created and then the odometer plots are added as object within the layout class. Later on when the object are put to the image the horizontal layout class will take all its objects and spread them out evenly along a horizontal line. The corresponding applies to the vertical layout class with the obvious change in direction.
The layout object are added to the graph in exactly the same was as odometers, by
calling the OdoGraph::Add() method.
The following line would create a horizontal line of odometer plots
1 2 3 4 | $row1 = new LayoutHor( array($odo1, $odo2, $odo3) ); $graph->Add( $row1 ); |
If we instead wanted the odometer stacked on top of each other the lines above would have to be changed to
1 2 3 4 | $row1 = new LayoutVert( array($odo1, $odo2, $odo3) ); $graph->Add( $row1 ); |
There is no limit to how many object can be added to a layout class.
If it was only possible to add odometers in the creation of layout classes it would be of limited use. The real power of layout classes is that they can be combined.
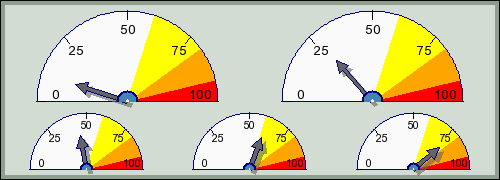
So for example if we wanted two odometers in the top row and three in the bottom row we can think of this as first creating two horizontal layout object which are then in there turn layout out vertically.
The following code shows how this could be done
1 2 3 4 5 6 7 8 9 10 | $row1 = new LayoutHor( array($odo1, $odo2) ); $row2 = new LayoutHor( array($odo3, $odo4, $odo5) ); // Combine the two rows in a column $col1 = new LayoutVert( array($row1, $row2) ); // The image will now have 5 odometers! $graph->Add( $col1 ); |
The following code shows a full example on how this is done
Example 20.5. Using layout classes for automatic positioning (odotutex18.php)
1 2 3 4 5 6 7 8 9 10 11 12 13 14 15 16 17 18 19 20 21 22 23 24 25 26 27 28 29 30 31 32 33 34 35 36 37 | require_once ('jpgraph/jpgraph.php'); require_once ('jpgraph/jpgraph_odo.php'); // Create a new odometer graph $graph = new OdoGraph(500,180); $odo = array(); // Now we need to create an odometer to add to the graph. for( $i=0; $i < 5; ++$i ) { $odo[$i] = new Odometer(); $odo[$i]->SetColor('lightgray:1.9'); $odo[$i]->needle->Set(10+$i*17); $odo[$i]->needle->SetShadow(); if( $i < 2 ) $fsize = 10; else $fsize = 8; $odo[$i]->scale->label->SetFont(FF_ARIAL,FS_NORMAL,$fsize); $odo[$i]->AddIndication(92,100,'red'); $odo[$i]->AddIndication(80,92,'orange'); $odo[$i]->AddIndication(60,80,'yellow'); } // Create the layout $row1 = new LayoutHor( array($odo[0],$odo[1]) ); $row2 = new LayoutHor( array($odo[2],$odo[3],$odo[4]) ); $col1 = new LayoutVert( array($row1,$row2) ); // Add the odometer to the graph $graph->Add($col1); // ... and finally stroke and stream the image back to the browser $graph->Stroke(); |

